

Gold price remained on edge today, September 24, as investors reacted to the soaring US bond yields. It dropped to $4,286, down by 8.55% from its lowest level in August this year. This retreat may continue as investors rotate to yielding assets.
US 10-year Treasury yield is soaring
Gold price retreatED as investors focused on the bond market after the US released strong services and manufacturing PMI report. According to S&P Global, the manufacturing PMI rose to 57 in September from 53.9 in August, higher than the expected 53.6. The services and composite PMI figures rose to 58.7 and 58.4, respectively.
These numbers meant that the US economy did relatively well despite the rising producer and consumer inflation. As a result, traders believe that the Federal Reserve may be forced to hike interest rates again this year. Odds of a hike have jumped to over 80% on Polymarket and Kalshi.
Gold tends to underperform the market whenever bond yields are rising because it is a non-yielding asset. As a result, investors tend to rotate to short-term government bonds whenever this happens. In this case, the ten-year spiked to a two-decade high of 5.1%.
Rising crude oil prices and inflation jitters
Gold price is falling because of the ongoing events in the energy market, where Brent and the West Texas Intermediate (WTI) rose overnight. Brent jumped to $102.5, while the West Texas Intermediate (WTI) moved to $92.
The rising oil prices is translating to higher gasoline and diesel costs. AAA data shows that the average gasoline price in the US has jumped to $4.47, while diesel moved to a record high of $6.52.
President Trump is now considering instituting a US diesel export ban, which he hopes will lower prices. In reality, such a move, while well-intentioned, would lead to higher prices since energy costs are determined by the international markets.
Meanwhile, gold is dropping as flows into the SPDR Gold ETF fades. The fund shed assets worth over $230 million on September 21. Falling inflows is a sign that demand among investors is waning.
Gold price technical analysis
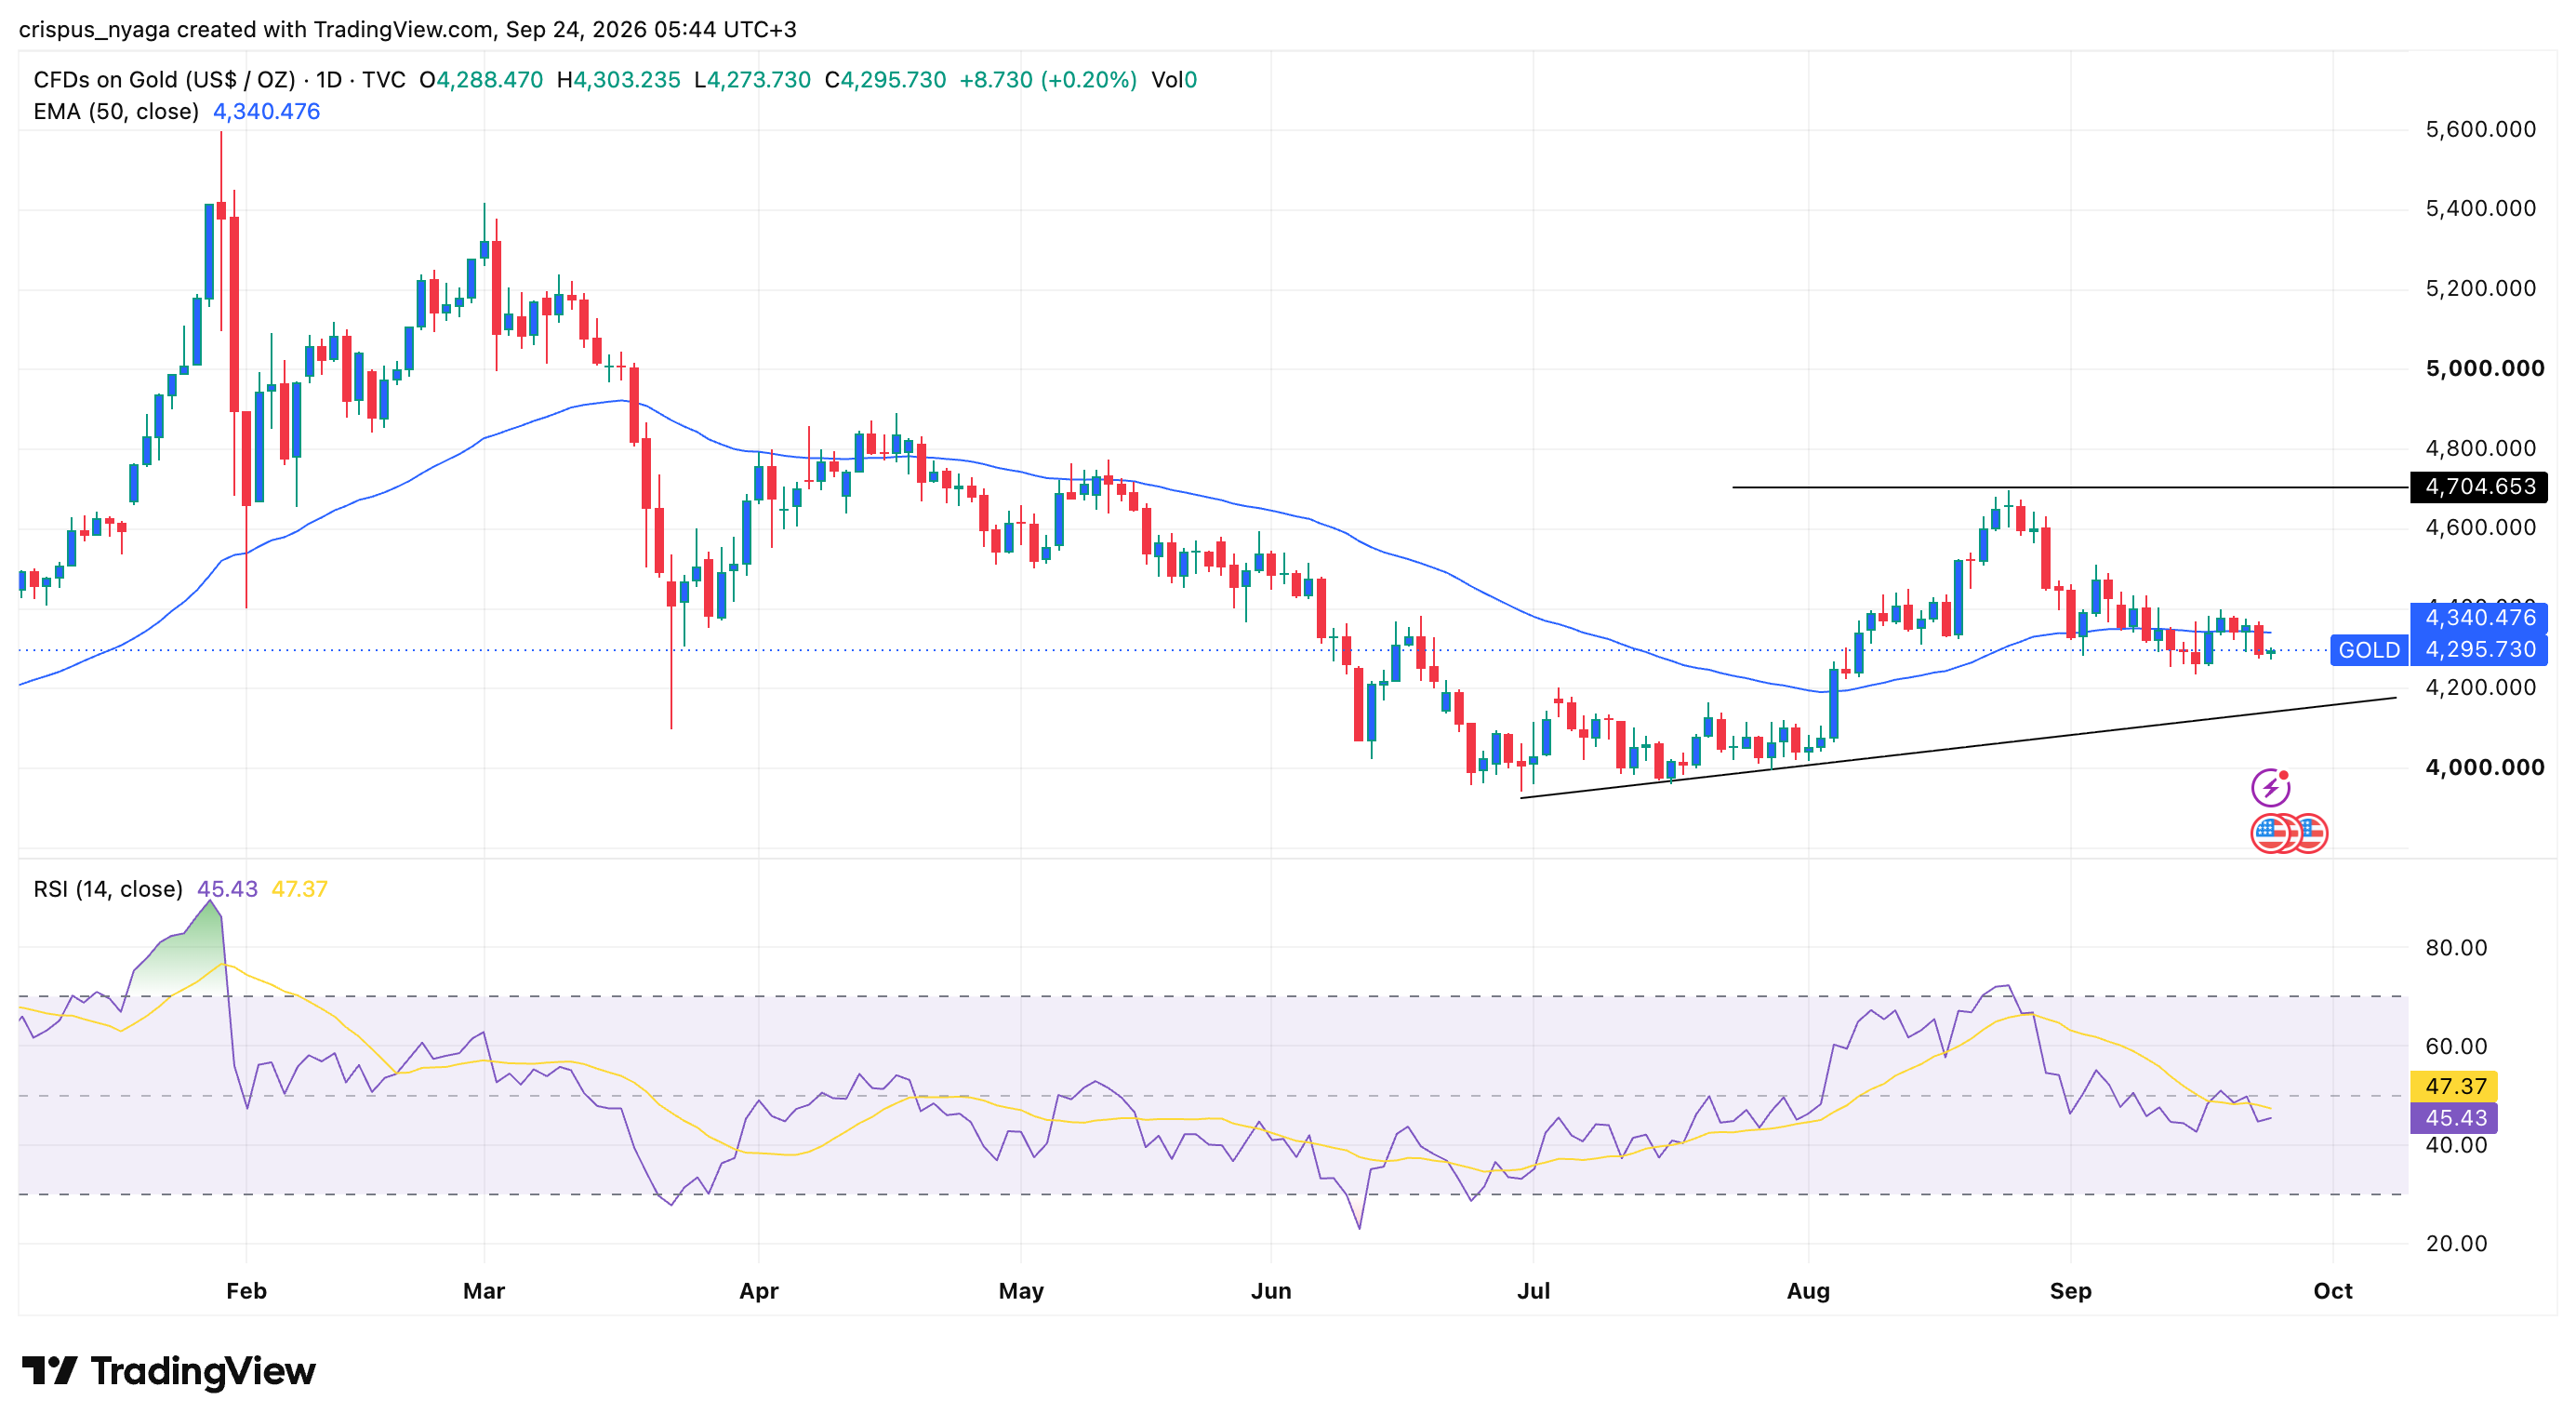
Gold price chart | Source: TradingView
The daily chart shows that gold has remained under pressure in the past few weeks. It retreated from a high of $4,705 to the current $4,290. This retreat continued after the Federal Reserve hiked interest rates by 25 basis points last week, with the dot plot pointing to more hikes this year.
Gold has now slipped below the 50-day Exponential Moving Average (EMA), a sign that bears have prevailed. The Relative Strength Index (RSI) has dropped below the neutral level of 50 and is pointing downwards. This performance suggests that the price is not yet in the oversold level.
Therefore, the most likely scenario is where it continues falling as investors target the ascending trendline that connects the lowest levels since June 30th this year. This target is at $4,200. A move above the key resistance level of $4,390 will invalidate the bearish outlook.
The post Gold price forecast as crude oil and US 10-year Treasury yield surge appeared first on Invezz