

One of the indicators that Carl Swenlin developed is the Silver Cross Index. It is one of the best participation indicators out there! Here’s how it works:
We consider a positive 20/50-day EMA crossover a “Silver Cross”. If a stock has a Silver Cross it has a bullish bias. The opposite of a Silver Cross is a Dark Cross. Stocks with a Dark Cross have a bearish bias.
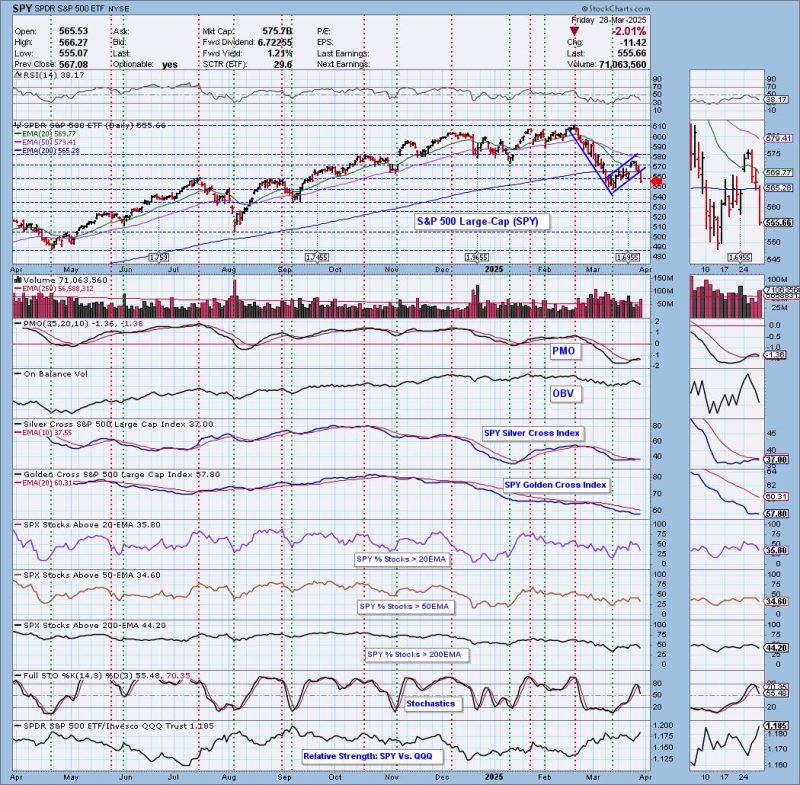
The Silver Cross Index measures the percentage of stocks holding Silver Crosses. The current percentage on the Silver Cross Index is just 37% so this tells us that 63% have bearish biases. This condition suggests to us that the market has more downside to absorb.
The Silver Cross Index was nearing a Bullish Shift across its signal line, but instead has topped. It is likely to continue declining given less stocks are above their 20/50-day EMAs versus the Silver Cross Index percentage.
Participation measured by the percent of stocks above their key moving averages are all below our bullish 50% threshold. Stochastics have topped and the PMO topped Friday. The short-term rising trend has been broken. This looks like a textbook reverse flag formation that was confirmed with Friday’s decline. The minimum downside target of the pattern would put price near 480. This sure has the earmarks of a failed bear market rally.
Conclusion: The Silver Cross Index is at a very low 37% and has now topped beneath its signal line. Participation, as measured by the %Stocks > 20/50EMAs, is mediocre at best and reading below the Silver Cross Index. This looks like the end of a bear market rally based on the bear flag that was confirmed on Friday.
(Note: This chart is from our “Under the Hood” ChartList on DecisionPoint.com. We have these charts with the Silver Cross Index for all the major indexes, sectors and select industry groups. All subscriptions include access to these charts!)
The DP Alert: Your First Stop to a Great Trade!
Before you trade any stock or ETF, you need to know the trend and condition of the market. The DP Alert gives you all you need to know with an executive summary of the market’s current trend and condition. It not only covers the market! We look at Bitcoin, Yields, Bonds, Gold, the Dollar, Gold Miners and Crude Oil! Only $50/month! Or, use our free trial to try it out for two weeks using coupon code: DPTRIAL2. Click HERE to subscribe NOW!
Learn more about DecisionPoint.com:
Watch the latest episode of the DecisionPointTrading Room on DP’s YouTube channel here!

Try us out for two weeks with a trial subscription!
Use coupon code: DPTRIAL2 Subscribe HERE!
Technical Analysis is a windsock, not a crystal ball. –Carl Swenlin
(c) Copyright 2025 DecisionPoint.com
Disclaimer: This blog is for educational purposes only and should not be construed as financial advice. The ideas and strategies should never be used without first assessing your own personal and financial situation, or without consulting a financial professional. Any opinions expressed herein are solely those of the author, and do not in any way represent the views or opinions of any other person or entity.
DecisionPoint is not a registered investment advisor. Investment and trading decisions are solely your responsibility. DecisionPoint newsletters, blogs or website materials should NOT be interpreted as a recommendation or solicitation to buy or sell any security or to take any specific action.
Helpful DecisionPoint Links:
Price Momentum Oscillator (PMO)
Swenlin Trading Oscillators (STO-B and STO-V)